
Measure Your Maven Build
Slow builds are annoying!
There, I’ve said it. And you know it’s true, don’t you? They take valuable time, they are a source of frustration, they extend the feedback cycle, and often they provide the perfect excuse for slacking off.
But it doesn’t have to be this way! Rather than getting another cup of coffee or playing that medieval game of gladiator, what if we would investigate why the build is so slow? If we know the bottlenecks, we can address them. That would shorten the feedback loop, increasing our productivity and our job happiness in one go.
To make it a bit more serious than sipping coffee and playing gladiator, let me refer to Quantifying the Costs of Builds, a report by Hans Dockter, the founder of Gradle and CEO of Gradle Inc. In this 2018 report, and I believe this is still relevant as of today, Hans writes:
We haven’t seen a company yet where investing into more efficient builds was not leading to a significant return on investment. The most successful software teams on the planet are the ones with an efficient build infrastructure.
So, it is definitely worth investing in having a fast build! With that out of the way, let’s start with the first step: measuring our build to find the bottlenecks.
Things to check before we start
Many things can influence the performance of your Maven build. A lot of time goes into improving the Maven code bases and making it as efficient as possible. It would be a shame not to leverage that work. So before continuing, let’s ensure that your environment satisfies the two starting assumptions:
- You use a modern version of Maven: version 3.9 or higher.
- Your build uses the latest versions of all the plugins it requires.
Criteria for comparing the tools
I’ll be running through a couple of tools that help you identify where Maven spends so much time. Each of these contestants will be scored on three axes:
- Ease of use — How convenient is it to use the tool? How much work is it to set up and run an experiment?
- Visual reports — How extensive is the visual reporting? Is it easy to read for a human?
- Different reporting formats — How easy is it to create reports in another format than the default one? What if you need the analysis to be processed by a different process?
I will be using commit 2bfa3a8 of Apache Maven (a snapshot of version 4.0.0-alpha-13) to evaluate three freely available tools.
Option 1: Maven Profiler
The first candidate is the Maven Profiler by Jean-Christophe Gay. It comes as a Maven extension, so you can use it by registering it in .mvn/extensions.xml:
<?xml version="1.0" encoding="UTF-8" ?>
<extensions xmlns="http://maven.apache.org/EXTENSIONS/1.1.0"
            xmlns:xsi="http://www.w3.org/2001/XMLSchema-instance"
            xsi:schemaLocation="http://maven.apache.org/EXTENSIONS/1.1.0 https://maven.apache.org/xsd/core-extensions-1.1.0.xsd">
    <extension>
        <groupId>fr.jcgay.maven</groupId>
        <artifactId>maven-profiler</artifactId>
        <version>3.2</version>
    </extension>
</extensions>
You run your build in the same way as you did before, but you add -Dprofile.
Setting the profile user property triggers the extension to collect measurements.
At the end of the build, you will notice one extra line of output
[INFO] HTML profiling report has been saved in: /path/to/project/.profiler/profiler-report-2024-03-03-15-01-38.html
Open that file in your browser and you will see something like this (click on the image to enlarge)

Pro
- Works with latest the Maven 4.0.0 snapshots
- Simple setup
- Can also export to JSON
- Can also export directly to the console
Con
- Reports are pretty basic
- No good visualisation of parallel builds
Option 2: Maven BuildTime Profiler
The second candidate is the Maven BuildTime Profiler by Karl Heinz Marbaise. This one, too, comes as a Maven extension, so you can enable it in .mvn/extensions.xml:
<?xml version="1.0" encoding="UTF-8" ?>
<extensions xmlns="http://maven.apache.org/EXTENSIONS/1.1.0"
            xmlns:xsi="http://www.w3.org/2001/XMLSchema-instance"
            xsi:schemaLocation="http://maven.apache.org/EXTENSIONS/1.1.0 https://maven.apache.org/xsd/core-extensions-1.1.0.xsd">
    <extension>
        <groupId>com.soebes.maven.extensions</groupId>
        <artifactId>maven-buildtime-profiler</artifactId>
        <version>0.2.0</version>
    </extension>
</extensions>
It will directly output its measurements to the console where you invoke Maven. Again, click the screenshot to get the full report.

Pro
- Works with the latest Maven 4.0.0 snapshots
- Simple setup
Con
- Only prints to the console
- No good visualisation of parallel builds
Option 3: Maven OpenTelemetry extension
The third contestant is the Maven OpenTelemetry extension. As the name reveals, it’s a Maven extension, and activating it should be no surprise by now:
<?xml version="1.0" encoding="UTF-8" ?>
<extensions xmlns="http://maven.apache.org/EXTENSIONS/1.1.0"
            xmlns:xsi="http://www.w3.org/2001/XMLSchema-instance"
            xsi:schemaLocation="http://maven.apache.org/EXTENSIONS/1.1.0 https://maven.apache.org/xsd/core-extensions-1.1.0.xsd">
    <extension>
        <groupId>io.opentelemetry.contrib</groupId>
        <artifactId>opentelemetry-maven-extension</artifactId>
        <version>1.33.0-alpha</version>
    </extension>
</extensions>
To use this extension, add the following user property to your Maven invocation: -Dotel.traces.exporter=otlp.
This activates exporting OpenTelemetry traces and metrics.
By default, it will publish data to http://localhost:4317, so we first need to have something on that address to process that data.
Setting up an OpenTelemetry Collector
For simplicity, we will use Jaeger to collect, process and visualise the build metrics. Other solutions exist, such as Prometheus and Grafana, but these need to be connected as well. Of course, if you happen to have that setup already, it would probably make more sense to reuse that.
To run Jaeger, we will use the “all-in-one” distribution, which is designed for quick local testing. It requires to have Docker available; if you don’t have that, they also offer binary distributions.
docker run --rm --name jaeger \
  -e COLLECTOR_ZIPKIN_HOST_PORT=:9411 \
  -p 6831:6831/udp \
  -p 6832:6832/udp \
  -p 5778:5778 \
  -p 16686:16686 \
  -p 4317:4317 \
  -p 4318:4318 \
  -p 14250:14250 \
  -p 14268:14268 \
  -p 14269:14269 \
  -p 9411:9411 \
  jaegertracing/all-in-one:1.54
When it is started, we can navigate to http://localhost:16686 and browse the Jaeger UI.
Now we can run our Maven build with -Dotel.traces.exporter=otlp, as mentioned before.
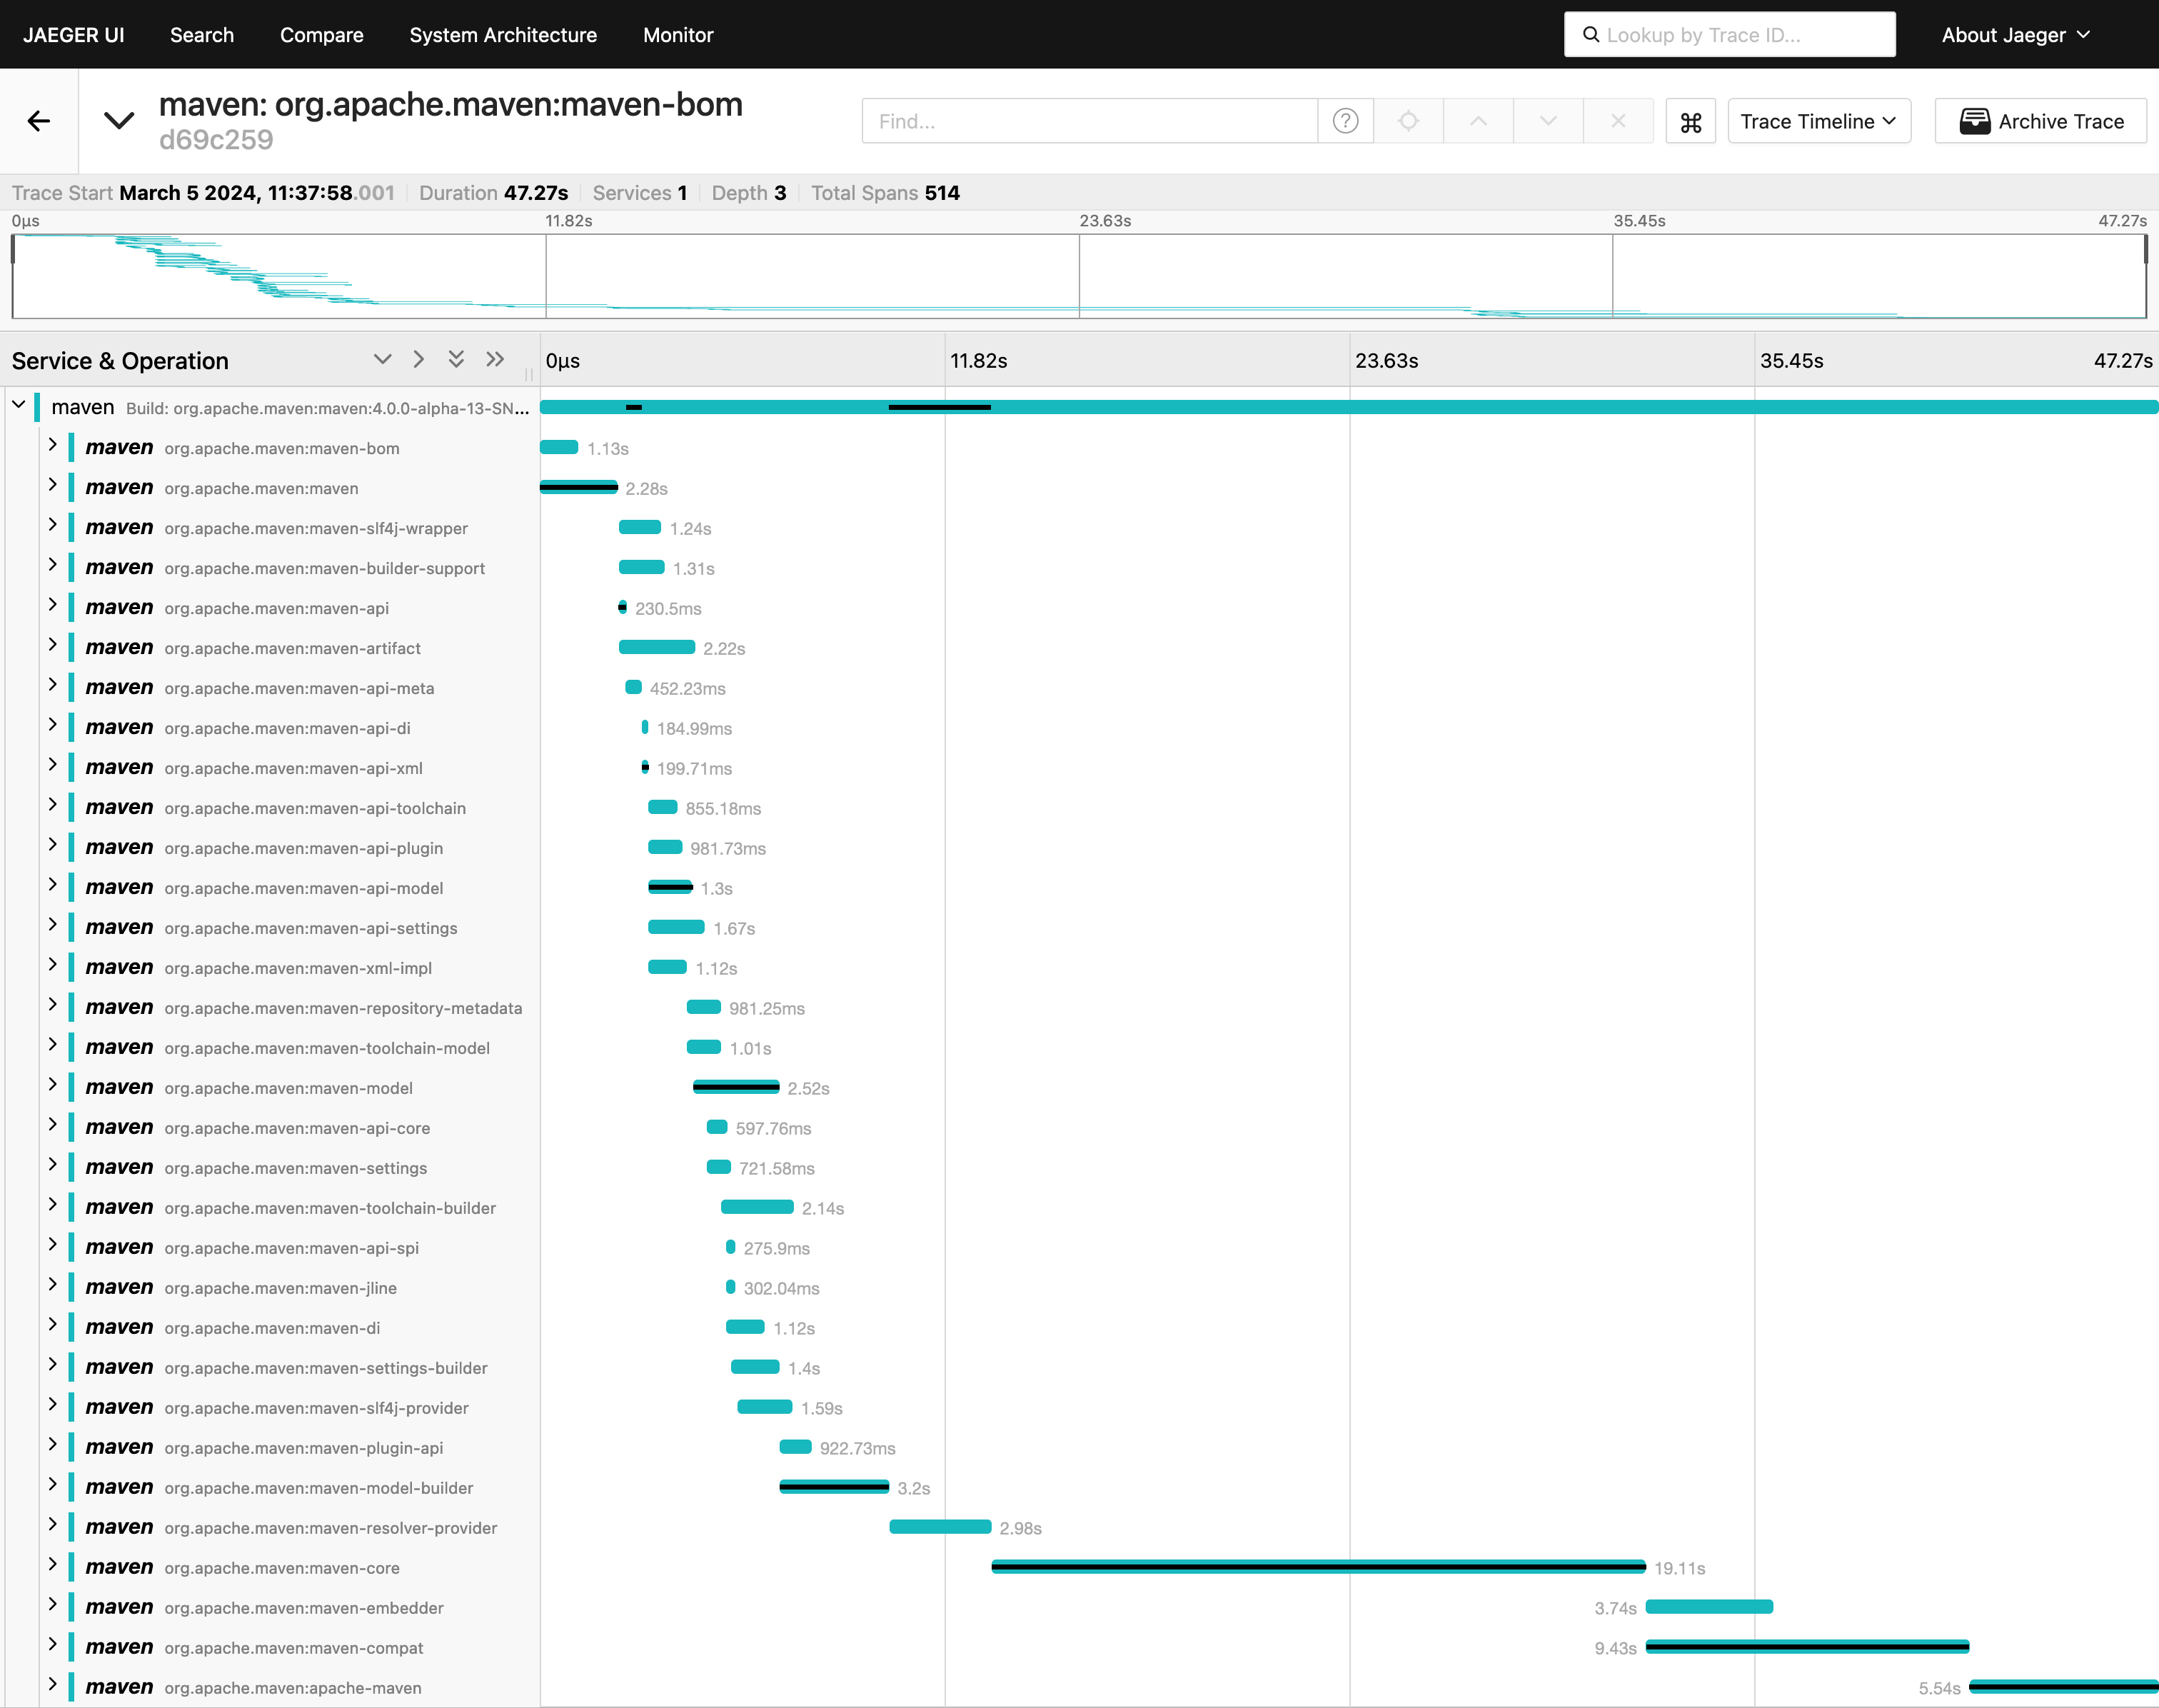
In the Jaeger UI, select “maven” as service and click “Find traces”.
You will see the Maven build you just ran; clicking on it will give you a visual trace of each step in the build and exactly how long it took.
Pro
- Prints summary to the console
- Visual reporting is aesthetically pleasing (although de gustibus non disputandum est)
- Very good visualisation of parallel builds
Con
- A more complex setup, requires additional tools such as Jaeger or other OpenTelemetry compatible product(s)
- Does not work with the latest Maven 4.0.0 snapshots
Comparing the tools
| Tool | Ease of use | Visual reports | Different reporting formats |
|---|---|---|---|
| Maven Profiler | ⭐⭐⭐⭐⭐ | ⭐ | ⭐⭐⭐⭐ (JSON) |
| Maven BuildTime Profiler | ⭐⭐⭐⭐⭐ | ⭐ | ⭐ (none) |
| Maven OpenTelemetry extension | ⭐⭐ | ⭐⭐⭐⭐⭐ | ⭐⭐⭐ (JSON, through Jaeger) |
Wrapping it all up
If all you’re looking for is a quick breakdown of the execution time of your Maven build, the Maven Profiler would be your quickest option. It is convenient to set up, processes a decent report and can even report in different formats if you’re looking to perform deeper analysis.
If you use multi-threaded builds, it might be worth spending a bit more time and using the Maven OpenTelemetry extension. It provides a very detailed view of which parts of your build ran at which point in time and may be essential in finding the bottlenecks for speeding up further. It is a bit more work to set up, though.
As a final thought, be aware — as attributed to Grady Booch — that
A fool with a tool is still a fool
In other words, don’t focus on the tool alone, but make sure you know how to use it. In this context, make sure than you understand the information the tool gives you and know how to value that information. Failing to do so and just changing stuff in your build will have no better effect that making random changes. Finding the right knobs and switches might be the subject of another post — or a complete talk.
comments powered by Disqus